Unpacking Iran's Gini Coefficient: A Deep Dive Into Income Inequality
Table of Contents
- Understanding the Gini Coefficient: A Global Perspective
- Iran's Gini Coefficient: Historical Trends and Data Sources
- The Nuances of Measuring Inequality in Iran
- Gini Coefficient and Public Health: The Case of Iran
- Global Context: How Iran Compares
- Factors Influencing Income Inequality in Iran
- Policy Implications and the Path Forward
- The Future of Income Inequality in Iran
Understanding the Gini Coefficient: A Global Perspective
The Gini index, or Gini coefficient, is a standard and widely used measure of inequality. It quantifies the extent to which the distribution of income or consumption expenditure among individuals or households within an economy deviates from a perfectly equal distribution. Conceptually, it is derived from the Lorenz curve, which plots the cumulative percentages of total income received against the cumulative number of recipients, starting with the poorest individual or household. If income were perfectly distributed, the Lorenz curve would be a straight diagonal line. The Gini coefficient is calculated as the ratio of the area between the Lorenz curve and the line of perfect equality, to the total area under the line of perfect equality. A lower Gini coefficient indicates more equal income distribution, while a higher coefficient suggests greater inequality. Historically, the Gini coefficient has seen significant shifts globally. The data indicates sustained growth in global inequality during the 19th and 20th centuries. For instance, in 1820, the global Gini coefficient was 0.50. By 1980 and 1992, this figure had risen to 0.657, reflecting a period of increasing global disparities. It's also important to note that major global events can influence these figures. According to the World Bank's Poverty and Shared Prosperity 2020 report, the Gini coefficient increases by about 1.5 points in the five years following major epidemics, such as H1N1, highlighting the vulnerability of income distribution to health crises. This global context is crucial for understanding the specific dynamics of Iran's Gini coefficient.Iran's Gini Coefficient: Historical Trends and Data Sources
Analyzing Iran's Gini coefficient requires a look at its historical data, which comes from various reputable sources, primarily the World Bank and the Statistical Center of Iran. These institutions provide critical insights into the nation's income distribution trends over several decades. The Gini coefficient data for Iran is updated yearly, offering a continuous picture of economic shifts.World Bank Data and Estimates
The World Bank's Poverty and Inequality Platform is a primary source for household survey data, obtained from government statistical agencies and World Bank country departments. This ensures a robust and consistent methodology for measuring income inequality across nations. For Iran, the World Bank has provided estimates and historical data that paint a detailed picture. Historically, the average Gini coefficient for Iran from 1986 to 2022 stands at 38.65 index points. This long-term average provides a baseline for comparison. The data also reveals fluctuations within this period. For example, the minimum value recorded was 34 index points, reached in 2013, suggesting a period of relatively lower income inequality. Conversely, the maximum value observed was 47.4 index points, indicating a period of significant disparity. Specific data points from the World Bank further illustrate these trends. World Bank estimate data was reported at 38.800% in December 2014, marking an increase from the previous number of 37.400% for December 2013. This suggests a slight uptick in inequality during that specific period. The World Bank's estimate data for Iran is updated yearly, with an average (median) of 43.600% from December 1986 to 2014, based on 9 observations. This longer-term median value indicates that, over a significant period, Iran has experienced a moderate level of income inequality when measured by the World Bank. The Gini coefficient based on World Bank data from 2014 was 38.8, which was nearly identical to the global average of 39.0 at that time, indicating Iran's position relative to the rest of the world.Statistical Center of Iran's Insights
While international bodies like the World Bank provide valuable external assessments, domestic agencies such as the Statistical Center of Iran offer direct, localized data. The latest report from the Statistical Center of Iran indicates a decreasing trend in Iran's Gini coefficient, which reflects income inequality. This is a positive sign, suggesting efforts to redistribute wealth or improve income parity may be bearing fruit. For instance, the latest value from 2022 is 34.8 index points, a decline from 35.5 index points in 2021. This recent data suggests a continued downward trend in inequality. However, it is crucial to interpret these figures with a nuanced understanding. As the data itself highlights, studies show that without considering the uninterrupted increase in inflation and the decrease in purchasing power parity, the result of a fair distribution of wealth cannot be achieved. This caveat is vital because a lower Gini coefficient might superficially suggest improved equality, but if the real purchasing power of all income brackets is eroding due to inflation, the perceived improvement in distribution might not translate into a better quality of life for the population, especially the lower-income groups. This brings us to the complexities of measuring income inequality in Iran.The Nuances of Measuring Inequality in Iran
Measuring income inequality is not merely about crunching numbers; it involves understanding the socio-economic context and the limitations of the chosen metrics. While the Gini coefficient is a popular and widely used index for measuring inequality, it does not explicitly express a parameter or a value judgment to reflect the opinion of authorities or researchers. This highlights the need for a deeper, more qualitative analysis alongside quantitative data.Inflation, Purchasing Power, and Real Wealth Distribution
The Iranian economy has frequently grappled with high inflation rates, which significantly impact the real value of income and savings. As mentioned, the Statistical Center of Iran's report acknowledges that a decreasing Gini coefficient might not fully capture the reality of wealth distribution if inflation and declining purchasing power are not factored in. For instance, if everyone's income increases by 10%, but inflation is 20%, then everyone is effectively poorer, even if the relative distribution of income remains the same or even improves slightly. This means that while the Gini coefficient for Iran might show a decreasing trend, indicating less disparity in nominal income, the actual economic well-being of households, particularly those at the lower end of the income spectrum, might not be improving. The erosion of purchasing power due to inflation disproportionately affects those with fixed incomes or limited assets, widening the gap between the cost of living and their ability to afford basic necessities. Therefore, a true assessment of wealth distribution and economic fairness in Iran must consider these macroeconomic factors alongside the Gini coefficient.Limitations and Alternative Perspectives
Beyond inflation, the Gini coefficient has other inherent limitations. One significant limitation is that it is not additive across groups. This means that if you have the Gini coefficient for urban areas and rural areas, you cannot simply add them together to get the national Gini coefficient. This non-additivity complicates detailed analysis, especially in a country like Iran with diverse regional economic structures. Furthermore, the Gini coefficient provides a single number that summarizes income distribution but doesn't reveal the underlying causes of inequality or where the inequality is most pronounced (e.g., between the very rich and the middle class, or the middle class and the poor). It also doesn't account for wealth inequality, which can be significantly different from income inequality, as wealth includes assets like property, stocks, and other investments. To address some of these limitations, a generalization of this index, known as the extended Gini coefficient, has been introduced to explain different versions of inequality. For decomposing inequality, there are also two main approaches that allow researchers to break down the overall Gini coefficient into contributions from different income sources or population groups. The UN also estimates a Coefficient of Human Inequality, which considers factors beyond just income, such as education and health, offering a broader perspective on disparities.Gini Coefficient and Public Health: The Case of Iran
The relationship between income inequality and public health outcomes is a well-researched area, and Iran provides a specific context for this correlation. Studies have explored how economic disparities can manifest in health indicators. For example, research has examined the Gini coefficients of per capita income and completed suicide rates in provinces of Iran. The findings showed a Gini coefficient of per capita income at 0.0994 (95% CI = 0.0638 to 0.1349) and for completed suicide rate at 0.3393 (95% CI = 0.2148 to 0.46338) across provinces. While these specific Gini values are for *provincial* per capita income and suicide rates, not national income distribution, they illustrate that inequality metrics can be applied to various socio-economic factors. The fact that the Gini coefficient for suicide rates is significantly higher than that for per capita income in provinces suggests that disparities in mental health outcomes, or factors leading to suicide, are more pronounced than income disparities at the provincial level. This highlights how income inequality, even at a regional scale, can have tangible impacts on public health and well-being, underscoring the importance of addressing economic disparities for overall societal health.Global Context: How Iran Compares
Placing Iran's Gini coefficient within a global context helps to better understand its position in terms of income inequality. As of 2022, Iran's latest Gini coefficient value is 34.8 index points. In comparison, the world average is 38.33 index points, based on data from 28 countries. This suggests that Iran's current level of income inequality is slightly below the global average, indicating a relatively more equitable distribution compared to many other nations. Historically, as noted earlier, Iran's Gini coefficient based on World Bank data from 2014 was 38.8, which was nearly identical to the global average of 39.0 at that time. This consistency suggests that while Iran's economic landscape is unique, its overall income distribution has often mirrored global trends, at least in terms of this single metric. The data from CEIC and Our World in Data, which reports Iran's Gini coefficient data as active status and updated yearly, averaging 0.365 (median) from December 1986 to 2022 with 19 observations, further confirms the long-term trend of moderate inequality. This comparison is crucial for policymakers and international observers. While Iran's Gini coefficient is not among the lowest globally (indicating very high equality), it also avoids the extreme high levels seen in some highly unequal societies. This moderate position suggests that Iran faces challenges in reducing inequality further, but it is not starting from a point of extreme disparity compared to the global average.Factors Influencing Income Inequality in Iran
The factors that shape Iran's Gini coefficient are multifaceted and deeply intertwined with its economic structure, political developments, and international relations. Understanding these influences is key to formulating effective policies aimed at reducing income inequality. One significant factor is the structure of the Iranian economy, which is heavily reliant on oil revenues. Fluctuations in global oil prices can have a profound impact on government revenue, which in turn affects social spending, subsidies, and employment programs – all of which can influence income distribution. Periods of high oil revenue might allow for greater social welfare spending, potentially reducing inequality, while sanctions or low oil prices could constrain such efforts, leading to increased disparities. Government policies play a critical role. Subsidy reforms, taxation policies, and social safety nets are direct tools for income redistribution. For instance, targeted cash subsidies aimed at lower-income households can help mitigate the effects of inflation and reduce poverty, thereby impacting the Gini coefficient. However, the effectiveness of these policies can be undermined by administrative inefficiencies or corruption. Inflation, as previously discussed, is a pervasive issue that disproportionately affects lower and middle-income households, eroding their purchasing power and exacerbating real inequality, even if the nominal Gini coefficient appears stable or declining. Economic sanctions imposed by international bodies have also had a significant impact, limiting Iran's access to international markets, hindering investment, and contributing to economic instability and inflation, which in turn can widen income gaps. Furthermore, the labor market dynamics, including unemployment rates, wage disparities between skilled and unskilled labor, and the informal sector's size, all contribute to the overall income distribution. Access to education and healthcare, regional disparities in development, and the distribution of land and other assets also play a role in shaping Iran's Gini coefficient.Policy Implications and the Path Forward
Given the complexities surrounding Iran's Gini coefficient and the factors influencing it, policy interventions must be comprehensive and strategically designed. The goal is not just to lower the Gini coefficient in nominal terms but to genuinely improve the economic well-being and purchasing power of all Iranians, particularly the most vulnerable. One key area for policy focus is inflation control. Stabilizing the economy and bringing down inflation rates would directly benefit lower and middle-income households, preserving their purchasing power and reducing the real income gap. This might involve prudent monetary policies, fiscal discipline, and efforts to address supply-side constraints. Reforming the subsidy system is another critical area. While subsidies can help the poor, untargeted subsidies often disproportionately benefit the wealthy and create market distortions. Moving towards more targeted social safety nets, perhaps through direct cash transfers or food stamps, could ensure that aid reaches those who need it most, thereby more effectively reducing income inequality. Investing in human capital through improved access to quality education and vocational training across all regions can help bridge the skills gap and increase earning potential for a broader segment of the population. This is especially important for rural areas and marginalized communities. Promoting small and medium-sized enterprises (SMEs) and fostering a more dynamic and diversified private sector can also create employment opportunities and reduce reliance on the state-dominated economy. Addressing regional disparities in development is also crucial. Policies that encourage investment and job creation in less developed provinces can help reduce the Gini coefficient by raising income levels in historically poorer areas. This includes infrastructure development, access to credit, and support for local industries. Finally, enhancing transparency and accountability in economic governance can help combat corruption and ensure that resources are distributed fairly, contributing to a more equitable society.The Future of Income Inequality in Iran
The trajectory of Iran's Gini coefficient in the coming years will largely depend on a combination of internal policy choices and external geopolitical factors. If the recent declining trend observed by the Statistical Center of Iran continues, coupled with effective measures to control inflation and boost purchasing power, Iran could see a genuine improvement in income distribution. However, persistent economic challenges, including sanctions, volatile oil prices, and the need for structural reforms, present significant hurdles. The emphasis on considering "uninterrupted increase in inflation and the decrease in purchasing power parity" alongside the Gini coefficient highlights a mature understanding of inequality measurement within Iran. This suggests that policymakers are aware of the limitations of a single metric and the need for a holistic approach to economic well-being. Ultimately, the future of income inequality in Iran hinges on the nation's ability to foster sustainable economic growth that is inclusive and resilient. This involves diversifying the economy beyond oil, strengthening the private sector, investing in human development, and implementing social protection programs that genuinely uplift the most vulnerable segments of society. Monitoring the Gini coefficient, along with other socio-economic indicators, will remain essential for tracking progress and adapting policies to ensure a more equitable and prosperous future for all Iranians. In conclusion, Iran's Gini coefficient offers a valuable lens through which to view its economic landscape and the ongoing efforts to address income inequality. While recent data suggests a positive trend, the complexities of inflation and purchasing power demand a deeper, more nuanced interpretation. By understanding the historical context, the methodologies, and the influencing factors, we gain a clearer picture of the challenges and opportunities facing Iran in its pursuit of a fairer distribution of wealth. What are your thoughts on the factors most impacting income inequality in Iran? Share your insights and perspectives in the comments below, or explore more of our articles on global economic trends and their societal impacts.- Arnold Germer Age
- Geri Mcgee
- Daisy Edgar Jones Boyfriend
- James Franco Wife
- Chloe Surreal Nationality

Calculation of the Gini Coefficient | The Geography of Transport
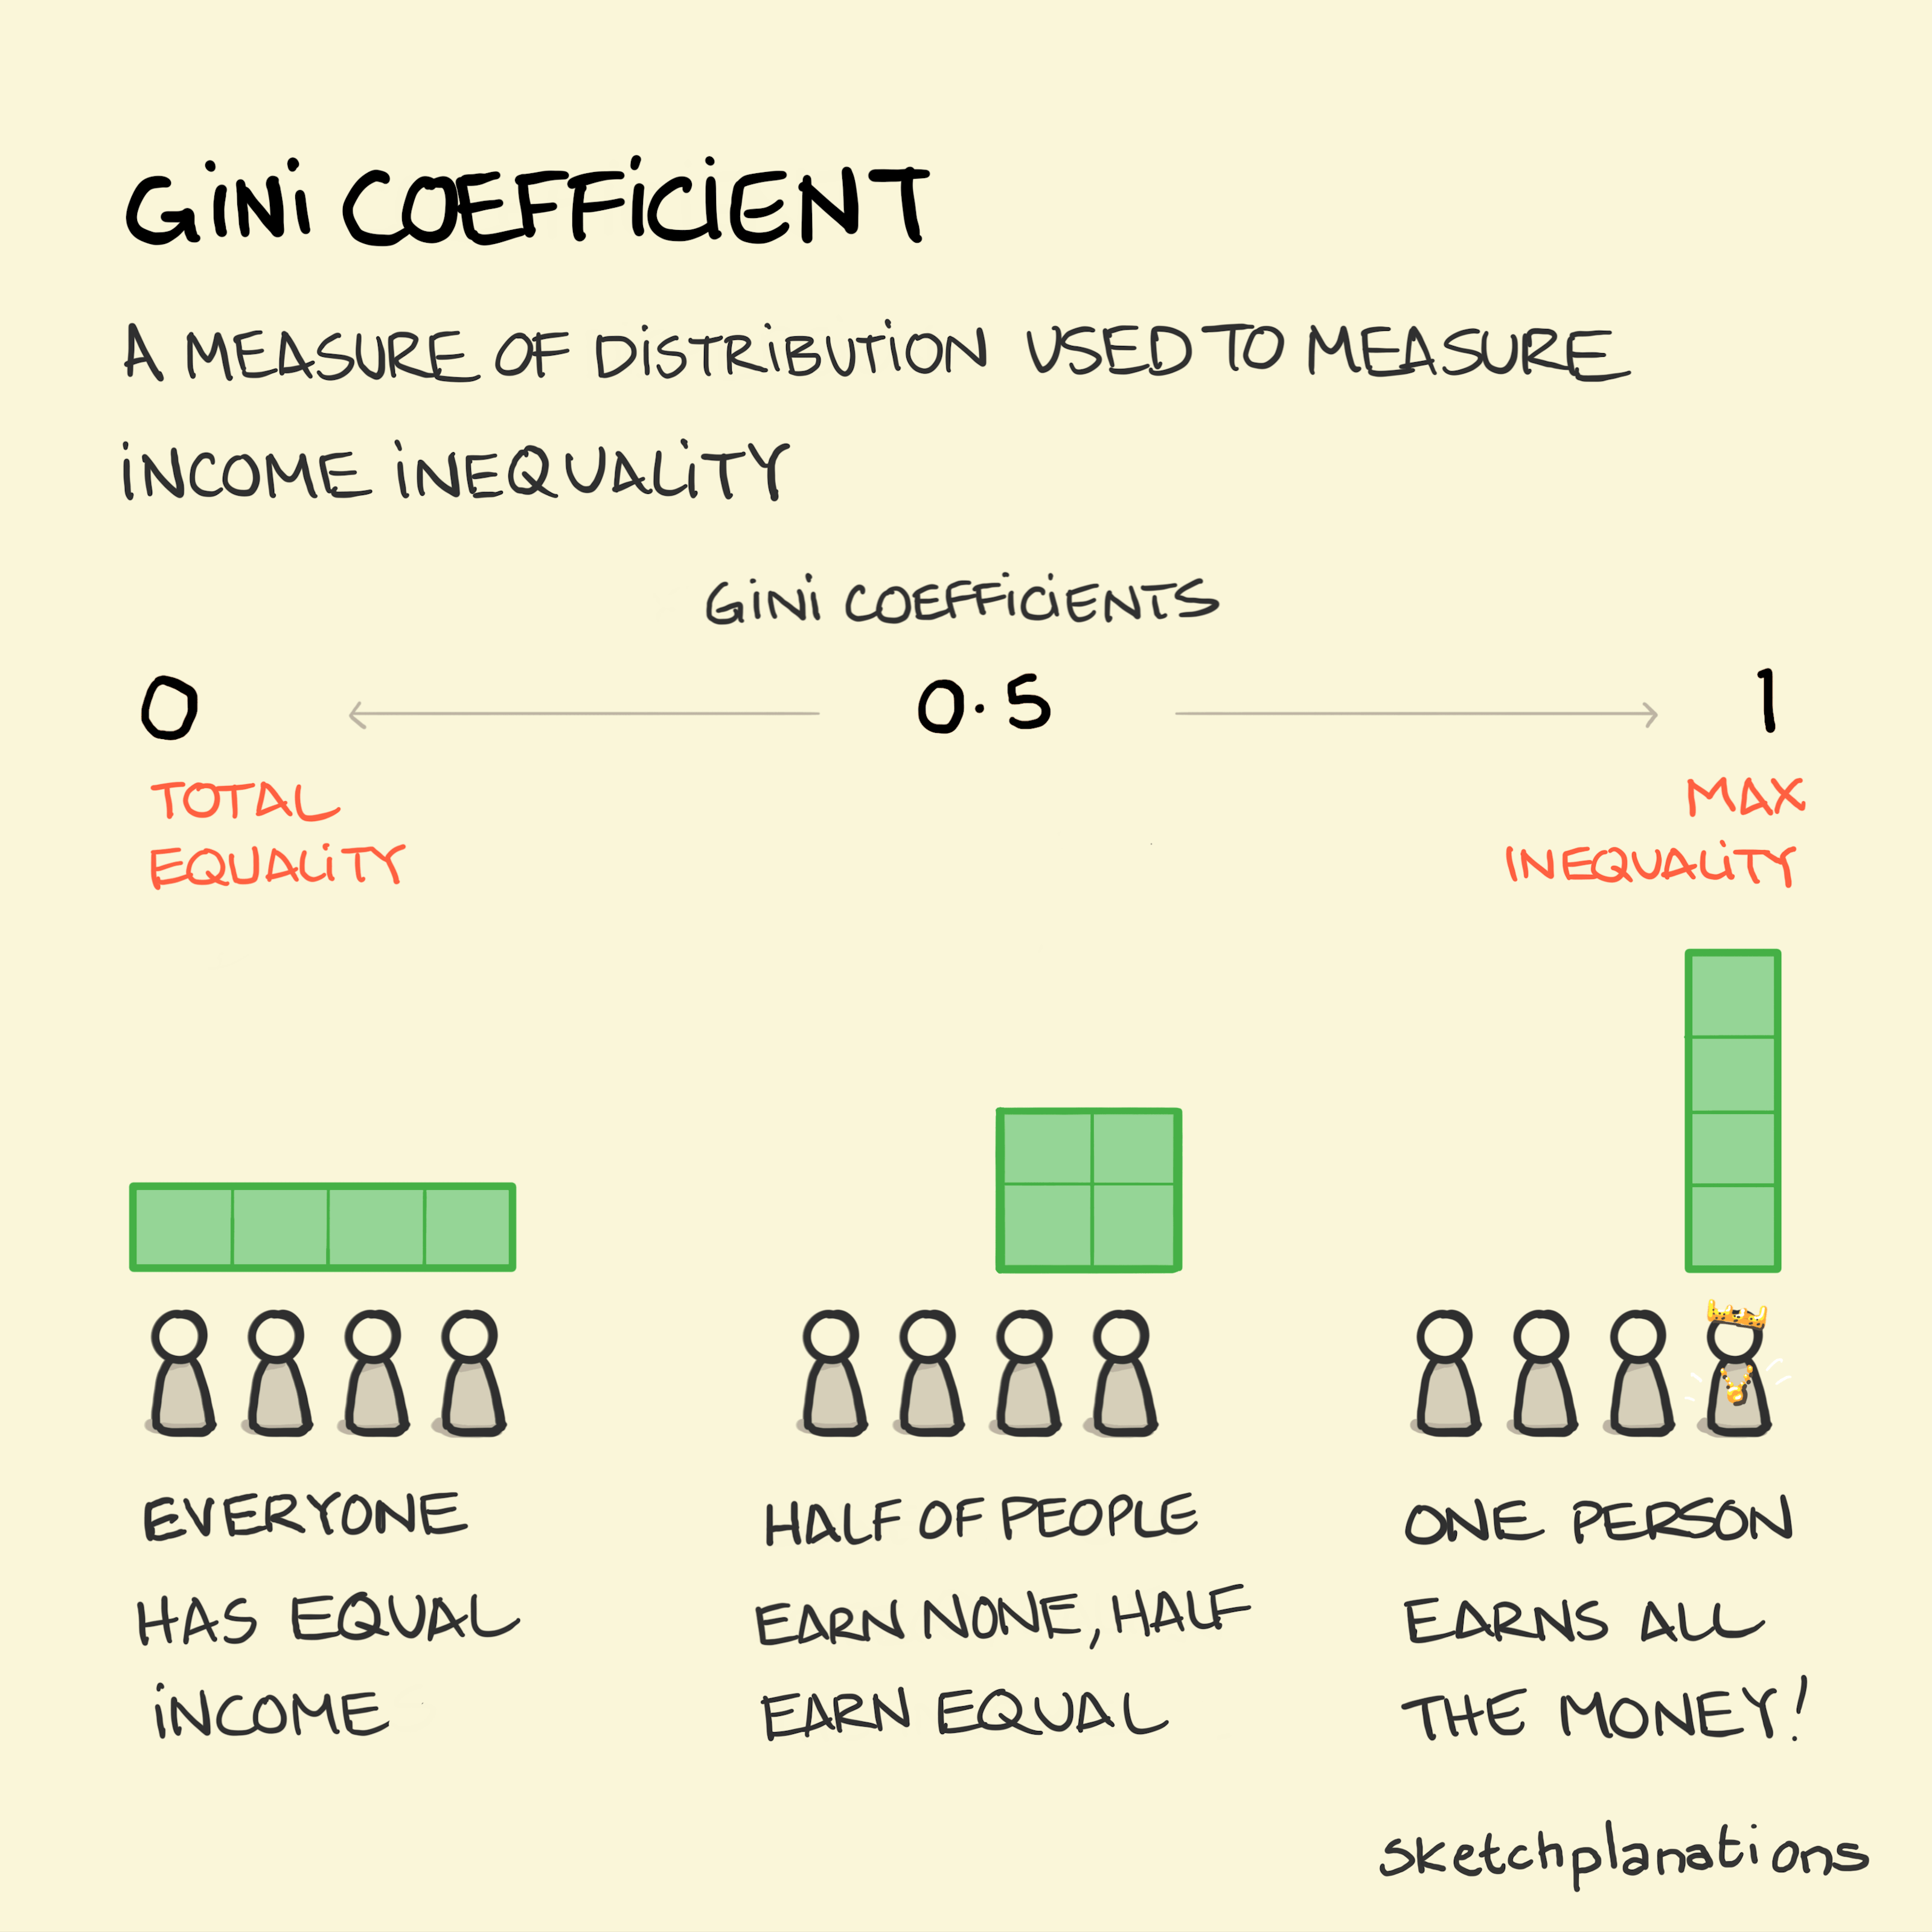
The Gini coefficient - Sketchplanations
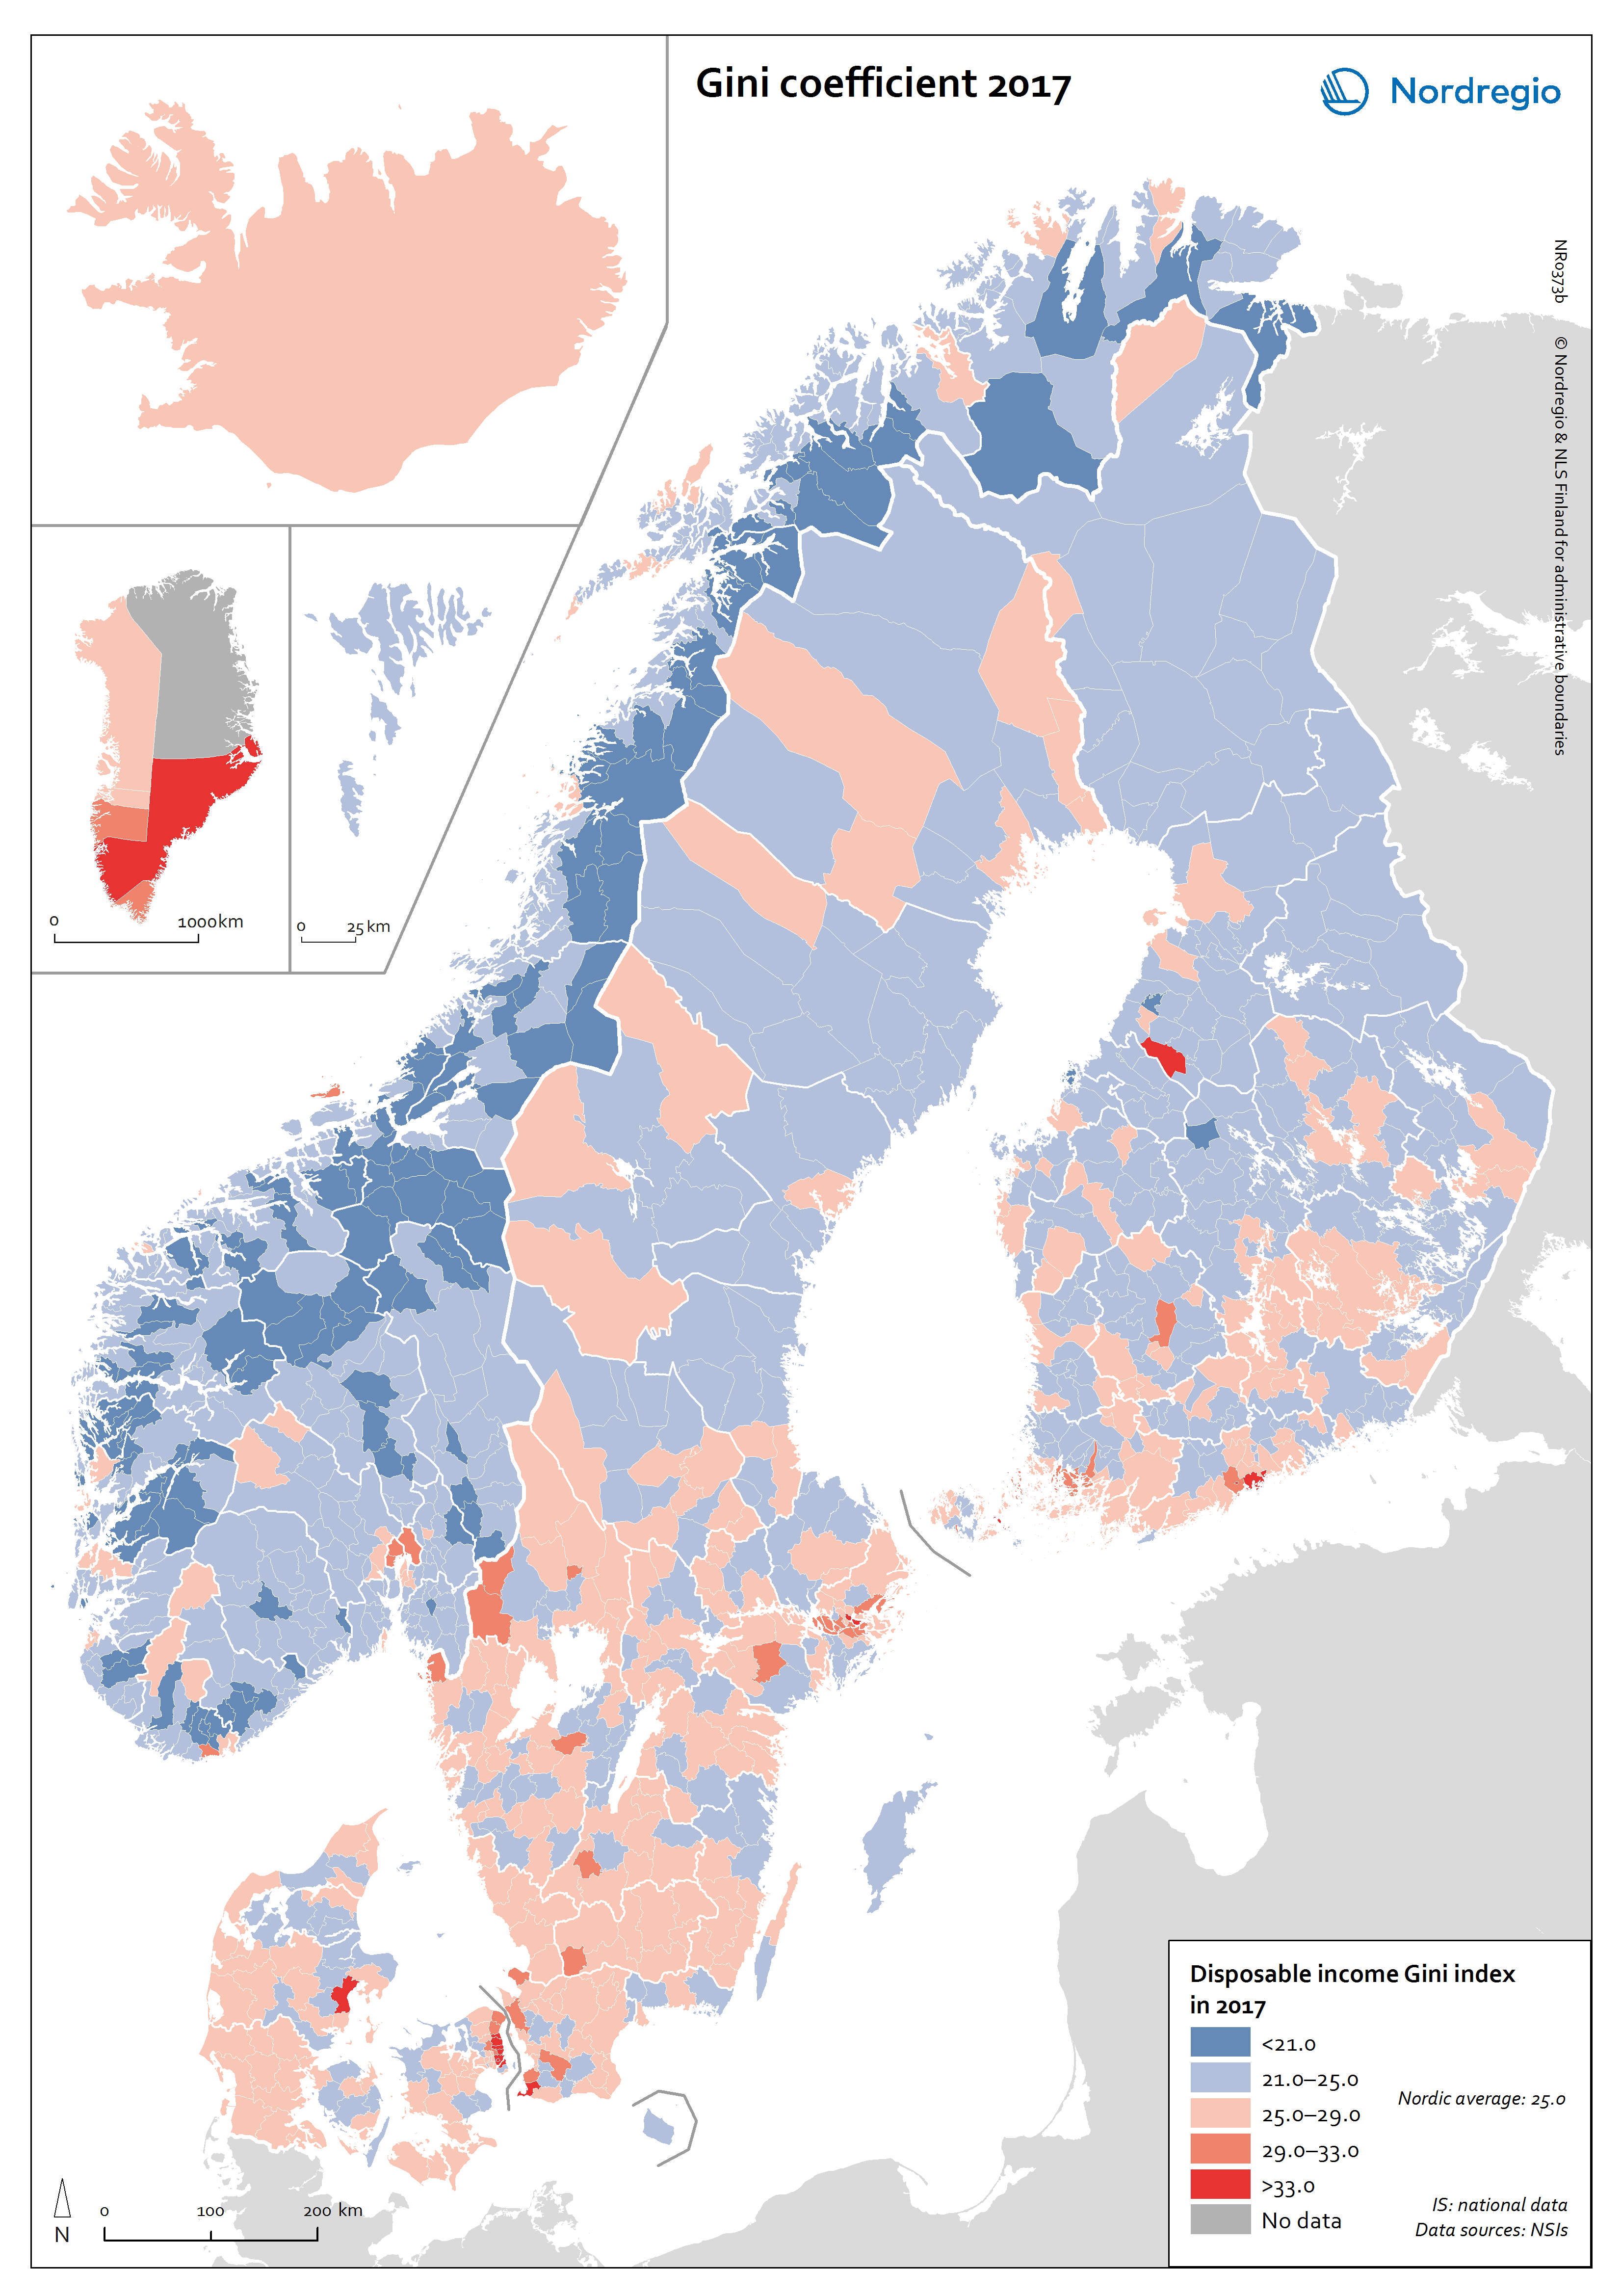
Gini coefficient 2017 | Nordregio
